Gamma Exposure Explained: The 'Hidden Force' in Options Markets & How It Moves Stock Prices

When stocks gap or snowball lower, traders often ask: why now? Sometimes, the answer lies in gamma exposure — the way options positioning forces market makers to hedge.
Gamma Exposure: The Hidden Force in Markets
In one of our most popular Barchart videos over on YouTube, Hans Albrecht — a former 13-year options floor market maker and 10-year fund manager — broke down how gamma exposure can create key support and resistance levels that traders need to watch.
Here, we’ve highlighted a quick clip to drill down on the concept of call walls and put walls, and how to identify them using Barchart tools.
Gamma Walls: Support and Resistance
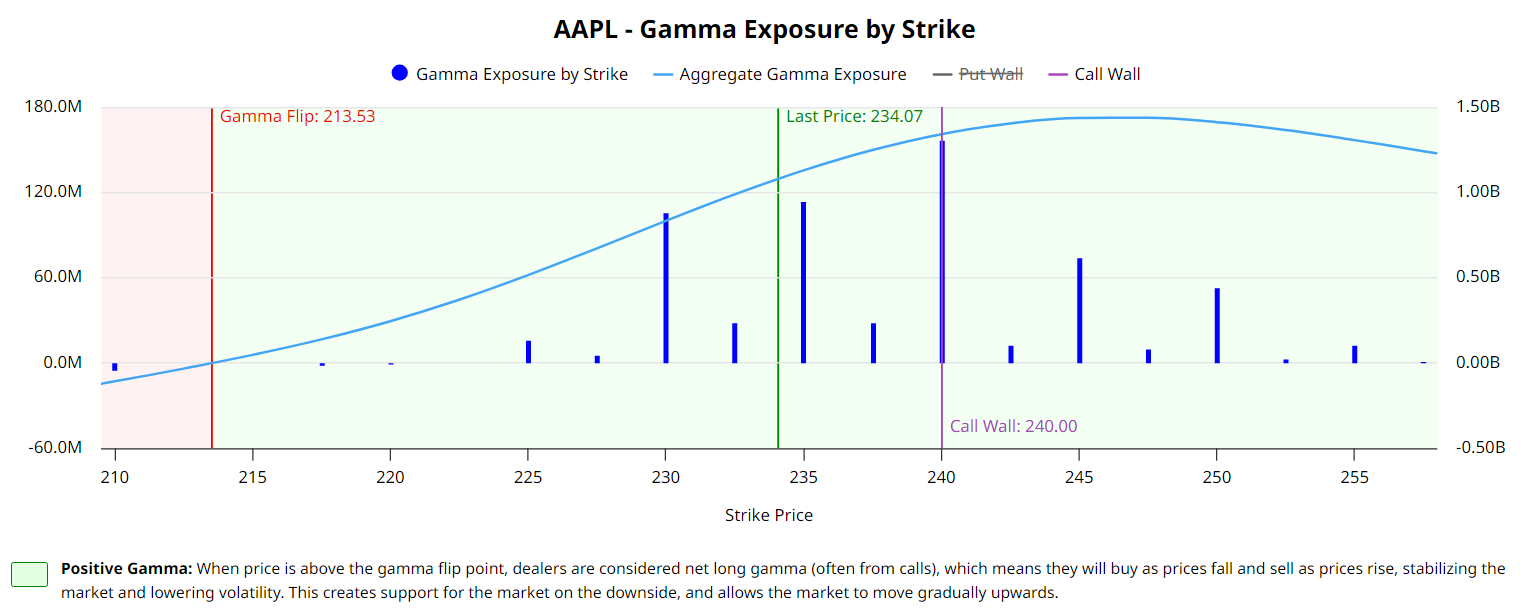
Hans highlighted how call walls and put walls can act like invisible guardrails on a stock’s price:
- Calls below price → support: If a stock falls to a call wall (say AAPL at $245 in the example clip), market makers who previously sold stock against those calls often have to buy it back. That creates demand and support.
- Calls above price → resistance: The same mechanism can cap upside.
- Closer to expiry = stronger effect: As expiration nears, hedging becomes more aggressive, magnifying support or resistance.
Case Study: SPY Snowball Selloff
On a tough day for markets, the SPDR S&P 500 ETF (SPY) slid steadily lower. Looking at the gamma profile using Barchart Premier, Hans pointed out:
- Significant negative gamma from $610 down to below $600.
- Dealers short large amounts of puts near $600.
- As SPY approached $600, delta increased on those puts, forcing dealers to sell more stock into weakness.
This created a “snowball effect” — hedging that accelerates the move already in motion.
Why Gamma Exposure Matters
Gamma profiles don’t cause moves by themselves. But in the presence of another price catalyst (like earnings, inflation data, or a Fed decision), they can exacerbate stock moves dramatically.
For traders, that means these “gamma walls” can mark key levels of support and resistance you don’t want to miss.
How to Track Gamma Exposure with Barchart
- Check the Gamma Exposure tool to see call/put positioning and hedging levels.
- Pair it with Options Flow data to confirm if institutions are leaning bullish or bearish.
- Use the Upcoming Earnings Screener and Economic Calendar to watch for macro events (like CPI data and Fed meetings) that could trigger sharp moves right into gamma walls.
Bottom Line
Understanding gamma exposure gives traders a behind-the-scenes look at how market makers hedge, and why certain price levels hold or break.
Watch this quick breakdown here:
See the complete video Options Trading Secrets: Supercharge Gains with Gamma Exposure on YouTube, and check out Gavin McMaster’s Unlock the Power of Gamma Exposure to Boost Your Options Trading for more.
On the date of publication, Barchart Insights did not have (either directly or indirectly) positions in any of the securities mentioned in this article. All information and data in this article is solely for informational purposes. For more information please view the Barchart Disclosure Policy here.